Tutorial:
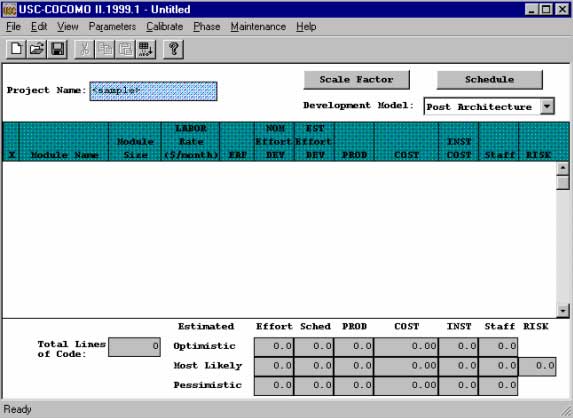
First, name the project. In the blue box next to Project Name, which now says <sample>, click on it and type First COCOMO. Now, we have to add a module. Go to the top menu and click on Edit, add the module. Then, change the name of the module created under module name from <sample> to my first module. To the right of this is a yellow box under module size; right now it is set as S:0. A yellow box means that data can be imputed.
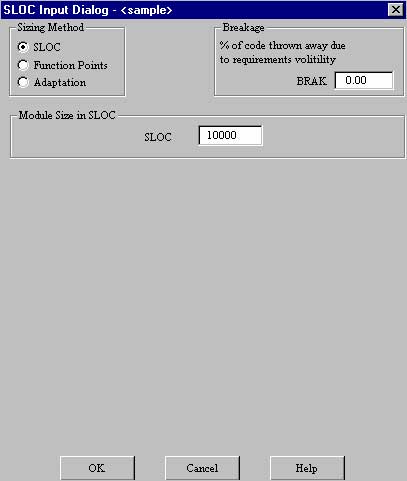
Click on this box and it will open a window entitled SLOC Input Dialog – my first module. Here we are given three ways to enter the module size, SLOC, Function Points, and Adaptation, whichever we choose depends on what parameters we are given. However, for our project we are only told that it will be a project with 10,000 lines of code. Let’s assume that we don’t know for sure which parameter our data falls under. This will give us a chance to use the Help function in the top menu. Click on that, and then COCOMO II Manual.
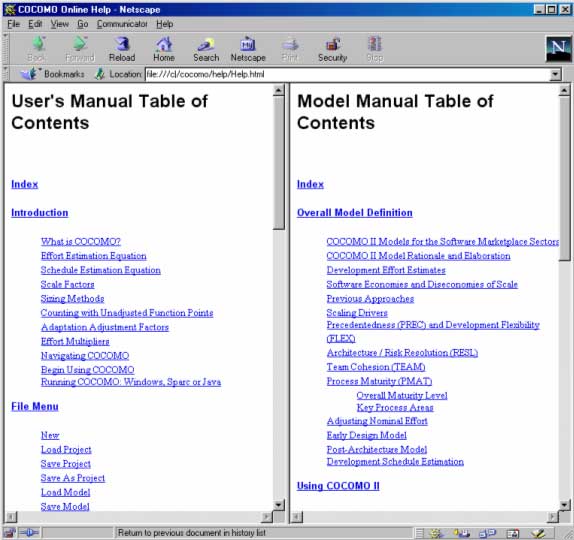
The COCOMO Manual will be opened with whatever is set as the default browser.
Since the window is entitled SLOC Input Dialog, we should search
for “SLOC” in the document. In Netscape, this is done by first clicking
in the frame we are looking in, in this case, the left one, and going to Edit,
Find in Frame. Do this now; you will see that “SLOC”
was not found in the User’s Manual Table of Contents.
We should now look in the index, click on the first link on the left called
Index. Do another search. Now we have more success, and quickly
find out that SLOC stands for “source lines of code.” Go back to
SLOC Input Dialog – my first module, and select SLOC
as Sizing Method. Now, put 10000 in the field
next to SLOC and click OK. Note, we could
also have had success by looking under Model Manual Table of Contents,
Using COCOMO II, Determining Size.
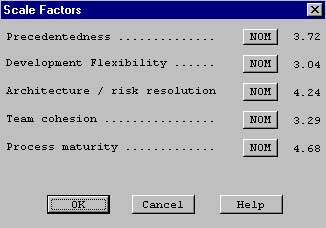
Next, we have to adjust our model for scale factors. Click the gray tab near
the top called Scale Factor. This will open the menu Scale
Factors, listing the factors and their ratings, which range from “very
low” to “extra high.” Scale factors are a significant source
of exponential variation on a project’s effort or productivity variation.
The default, nominal, is put here as NOM; clicking on this
button will cause the rating to toggle. However, for our project, our boss didn’t
tell us to do otherwise, so we will leave the scale factors as NOM.
Click OK.
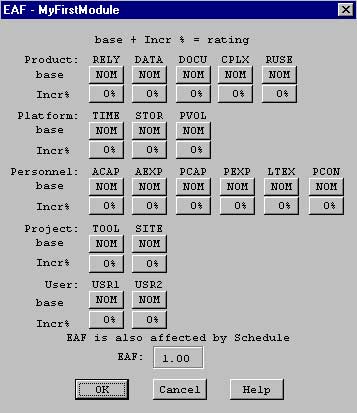
Now, we need to input the EAF, or Effort Adjustment Factors. There is another yellow box below EAF, which if we click on, will open a window for us to change the ratings for the effort adjustment factors. However, again, our boss has not told us to change any of these settings, so we will leave them as nominal. If we needed to, though, we could always click on the box that says NOM under the adjustment factor to toggle it to the setting we need. Click OK.
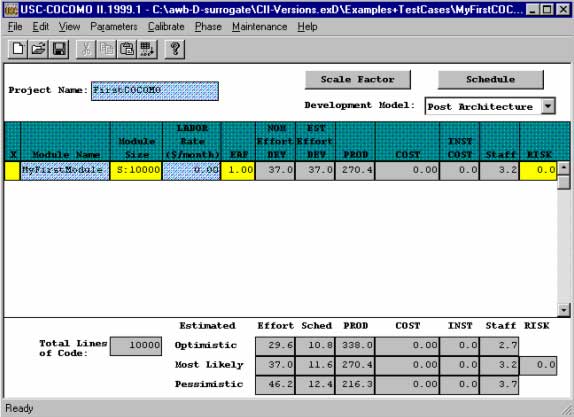
Well, we now look at the bottom table for the results of our module. Look at the vertical axis Estimated to Most Likely and across at the value under Effort. This says for a module with 10,000 lines of code that the estimated effort will most likely be 37.0. 37 is the number of Person Months needed to complete the project. Note, the project is not just the writing of the program, but all the product design (analysis), all the detailed design, all the unit test and integration and test, and all the documentation for the program as well.

Now, the nice thing about COCOMO II is that we can see how the effort is laid out over these different phases of the project. To do this, go to the top menu and click Phase, then select Project, Overall Project. This opens the window Phase Distribution – Project Overall. From the two left most columns we can see that the Plans and Requirements phase, which is 7% of the effort of the overall project (PCNT), will take 2.589 Person Months (Effort PM). (36.987 x .07 = 2.589). The other three columns relate to schedule and staff, which we will get to.
You might notice that the percents listed in the second column don’t add up to a hundred, even when you consider that Detail and Design and Code and Unit Test are both sub-parts of Programming. This is because the Plans and Requirements phase isn’t included in the overall effort, just Product Design, Programming, and Integration and Test, as evident in the summation of percentage. (6.288 + 22.470 + 8.230 = 100). We’re done with this for right now. Click OK.

We’re back at the main page. Look again at the bottom table at the Estimated, Most Likely row. There is a column labeled Sched which has the value 11.6 estimated as most likely. Sched stands for Schedule; this says that 11.6 months is, most likely, the best time to plan for the project’s completion. Further, there is also the column Staff, which gives the value of 3.2 as the most likely estimate. This says that 3.2 people are the optimum number of people for a project, most likely. You can see now how the effort was computed, as months X people = person months, or, rather, Staff multiplied by Schedule equals Effort. (3.2 X 11.6 = 37.0; accounting for rounding error).
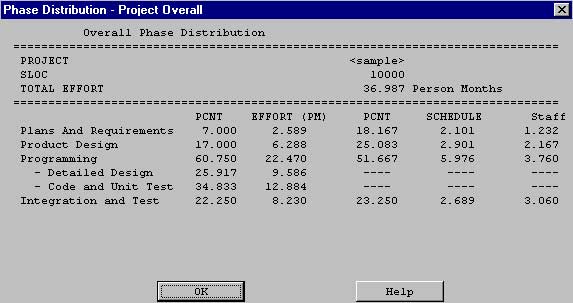
That said, go back to Phase Distribution – Project Overall (which we got to through Phase, Project, Overall Project). Notice the third and fourth columns PCNT and Schedule, this time PCNT relates to percentage of Schedule, not Effort. Note again that the Plans and Requirements phase is not computed into the overall Schedule, as evident in the summation of percentage. (25.083 + 51.667 + 23.250 = 100) Finally, the right most column, Staff, describes staff, and how many people should be assigned to each task. Again, click OK.
Now that we have found out all we need to know for our project, we are almost ready to exit COCOMO II. However, we will need the values of this project later, so we’ll need to save. Go to File on the top menu, click on it, and then click Save Project. A Save As window will appear. Now, navigate to your COCOMO directory (most likely in C:) then click on the Create New Folder icon. Change the name of the new folder to First COCOMO and double click on it. Then, type in the First COCOMO as the file name and click Save.
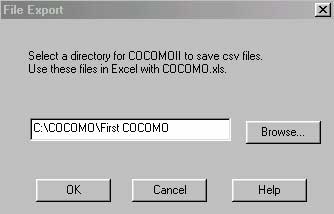
Now we want to see the data displayed graphically, so we’ll have some charts to present our boss. We’ll need to export the file so it can be used in Excel in the spreadsheet COCOMO.xls. Go to the top menu and select File, Export which will open the window File Export. The folder you saved the project in will be displayed, in this case, C:\COCOMO\First COCOMO. Click OK. Notice below in the main window it says Main.csv & Phase.csv are saved in C:\COCOMO\First COCOMO\. Main.csv and Phase.csv are the same file names used every time you export (.csv stands for Comma Separated Values, the type of file which COCOMO uses to export information); because we put “First COCOMO” in its own directory, we won’t have to worry about conflicts or not knowing which files belong to which projects. Go to the top menu and select File, Exit.
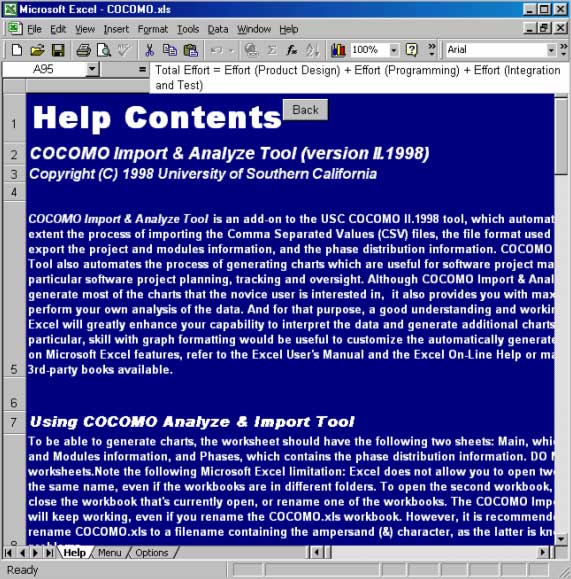
Open COCOMO.xls, it should be in your start menu, under Programs, COCOMO II.1998 or you can probably run C:\COCOMO\COCOMO.xls. It will ask to Enable Macros, click Enable Macros. Again, because COCOMO.xls will be the same file name for every project, save COCOMO.xls in this the directory we are working in. Do this by going to the top menu and selecting File, Save As…. Navigate to First COCOMO and save it as COCOMO.xls; now we will be working with the copy specific for this project. Notice at the bottom there are three tabs Help, Menu, and Options; these correspond to three “workbook sheets,” as they are called by Excel.
We are in the sheet Help, as that is the tab highlighted. Since the text probably runs off the edge of the viewable area, we’ll adjust the zoom to make it readable. Since cell A95 is already selected and each cell is the same width, go to the top menu and select View, Zoom…, then select Fit Selection and click OK. You can come back to the help sheet whenever you need, again you can use the “Find” function (ctrl + f) function to search for a keyword. Right now, click on the Menu tab at the bottom. Again, you can adjust the zoom to fit your specifications.
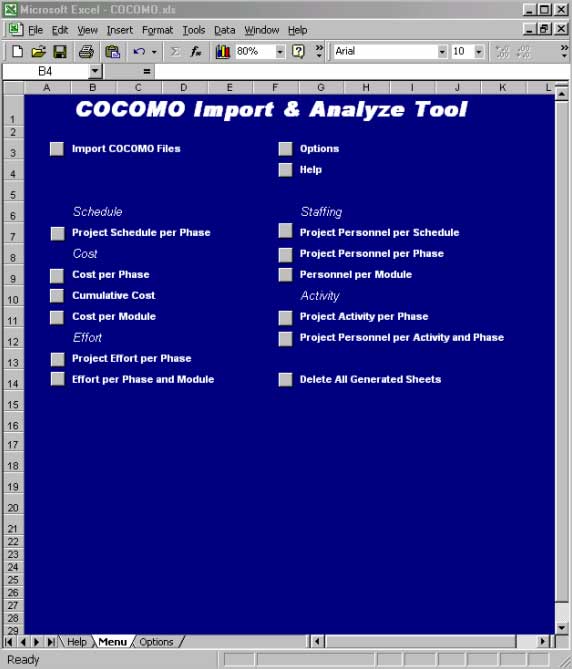
There is a gray box labeled Import COCOMO Files, click on this. Notice a window called Browse for Folder appears; let’s say we’ve forgotten what folder we saved the files that we need (even though we went through the trouble to make a directory just for them). Click Cancel. Click on the lower tab, Options. Next to Path is where the files we need to import, most likely C:\COCOMO\First COCOMO. Go back to Menu and Import COCOMO Files, now navigate to the folder listed next to Path in the Options, namely, First COCOMO, click on it so that it is highlighted and click OK. Notice that now there are two new tabs Main and Phases.
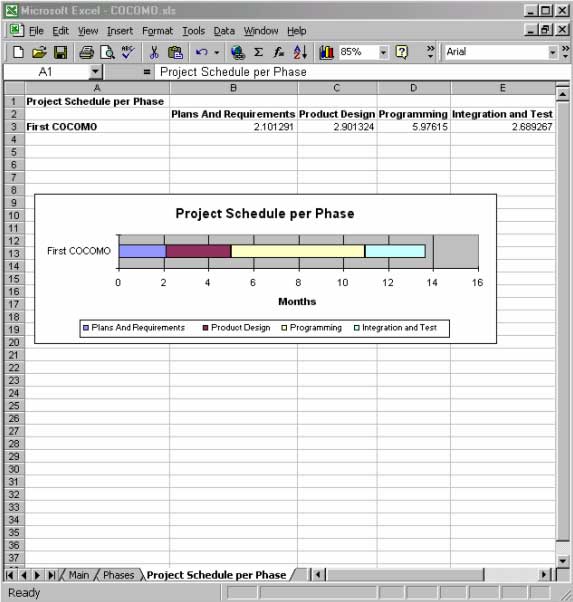
Click on the bottom tab Menu; you may have to scroll through the sheet tabs with the arrows the left to get to Menu. There are charts and graphs available in Menu to display parameters such as Schedule, Cost, and Effort. Click the gray box next to Project Schedule per Phase. This will open the sheet Project Schedule per Phase. Notice that the graph seems to show the summation of the schedule as about 13.5 Months. However, this should not be looked at as the “total” schedule, which we found earlier to be 11.6. Again, this is because in calculating the total schedule, COCOMO doesn’t include Plans And Requirements.
Of course, you can also see Project Effort per Phase or Personal Personnel per Phase or anything else offered in Menu by clicking on the gray box next its the label. It would be a good idea to explore COCOMO.xls, and COCOMO.exe, on your own to better accustom yourself with both tools. However, right now, go to the top menu and click File, Exit. When the window appears asking you if you want to save the changes, click Yes, in case you want to come back to this tutorial. Now we have finished the tutorial. Hopefully, you have a better understanding of the COCOMO tool. You should be able to go on to the next tutorial or go ahead and start using COCOMO.